





TradeSmith Unveils Behavioral Profile Analysis System to Identify High Probability Market Signals Using Predictive Pattern Recognition

The financial technology sector is witnessing a paradigm shift as traditional methods of market analysis increasingly struggle to keep pace with the velocity of modern algorithmic trading. TradeSmith, a Baltimore-based financial technology firm, has announced the development and upcoming launch of a proprietary system known as Behavioral Profile Analysis (BPA). This system, developed over the course of a year with a multi-million dollar investment, seeks to move beyond standard fundamental and technical analysis by identifying unique "behavioral thumbprints" for thousands of individual stocks. By analyzing more than 2,000 equities daily, the BPA system aims to detect specific patterns that have historically preceded significant price movements, often with accuracy rates exceeding 90% in historical backtesting.
The methodology behind Behavioral Profile Analysis draws an unconventional but illustrative parallel to professional sports strategy, specifically the preparation techniques employed by former New England Patriots head coach Bill Belichick. During his tenure, which included six Super Bowl victories, Belichick was noted for constructing exhaustive behavioral profiles of opposing players. These profiles went beyond basic statistics, examining how specific quarterbacks responded to external variables such as inclement weather, different playing surfaces, or the officiating styles of particular referees. TradeSmith CEO Keith Kaplan asserts that stocks exhibit similar individualistic behaviors, reacting to economic stimuli and market volatility in predictable, repeatable patterns that are unique to each ticker symbol.
The Evolution of Market Analysis Methodologies
For decades, the investment community has relied primarily on two pillars of evaluation: fundamental analysis and technical analysis. Fundamental analysis, popularized by figures such as Warren Buffett, focuses on a company’s intrinsic value, examining earnings, debt-to-equity ratios, and management efficacy to determine if a stock is undervalued or overvalued. While effective for long-term value discovery, this method often treats all companies within a sector through a homogenized lens, assuming they will react similarly to broad economic shifts.
Technical analysis, conversely, focuses on price action and volume, utilizing chart patterns and oscillators to predict future movements. While this approach accounts for market sentiment, it frequently applies the same universal indicators—such as Relative Strength Index (RSI) or Moving Average Convergence Divergence (MACD)—to vastly different asset classes. TradeSmith’s BPA system represents a third evolution, which Kaplan describes as a "thumbprint" approach. This method operates on the premise that a technology giant like Oracle Corp. (ORCL) possesses a fundamentally different behavioral DNA than a traditional retailer like Macy’s Inc. (M) or a pharmaceutical staple like Pfizer Inc. (PFE).
By utilizing high-performance computing, the BPA system evaluates 2.09 million potential trade combinations across 2,467 stocks every 24 hours. The goal is to identify the specific confluence of factors—ranging from volatility spikes to calendar-based anomalies—that trigger a high-probability move for a specific security.
Case Studies in Behavioral Pattern Recognition
To demonstrate the efficacy of the BPA system, TradeSmith has released data from several recent trade signals that illustrate the diversity of the patterns identified. These examples highlight how the system ignores universal rules in favor of asset-specific triggers.
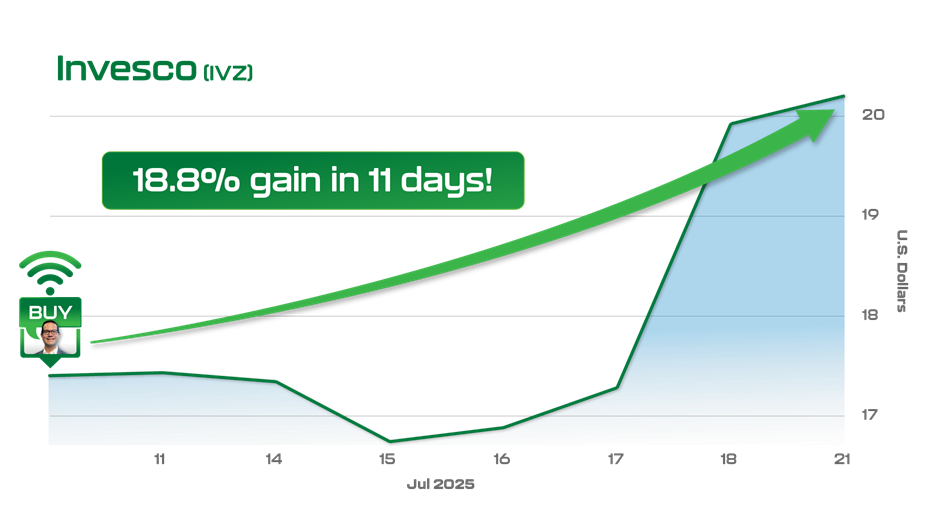
In the case of Invesco Ltd. (IVZ), one of the world’s largest investment management firms, the BPA system identified a recurring pattern involving the alignment of two specific technical indicators: the Bollinger Percent B and the Money Flow Index (MFI). The signal was programmed to fire only when both metrics exceeded a value of 80. Bollinger Percent B quantifies a stock’s price relative to its upper and lower Bollinger Bands, while the MFI serves as a volume-weighted version of the RSI, indicating the strength of money flowing into the asset. When these specific conditions met for IVZ, the stock realized an 18.8% gain within an 11-day window.
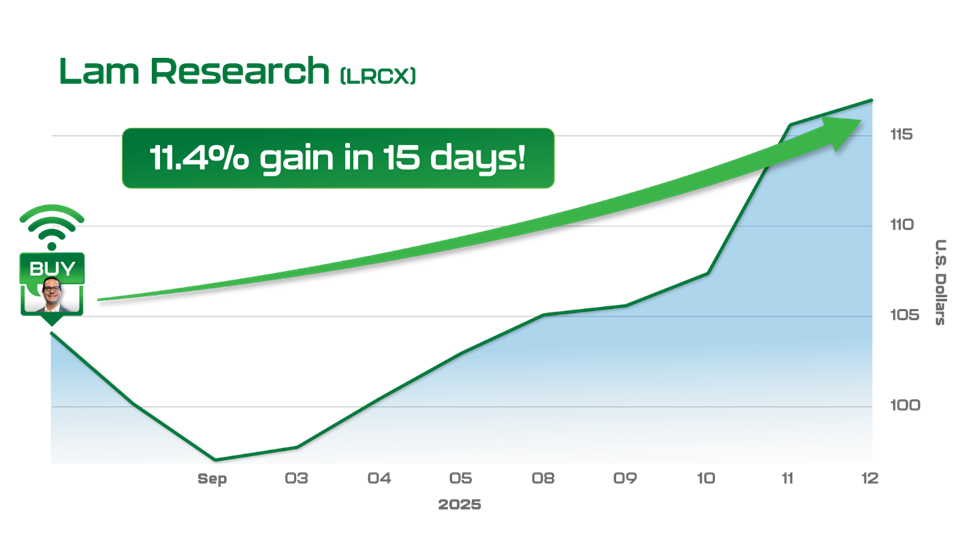
A different behavioral profile was observed for Lam Research Corp. (LRCX), a major provider of wafer-fabrication equipment to the semiconductor industry. The BPA system found that LRCX’s most reliable signal was not tied to complex oscillators, but rather a combination of a price floor and a calendar event. The signal required the stock to close above its 200-day moving average exactly two trading days prior to a market holiday. In August 2025, this specific alignment occurred two days before Labor Day, resulting in an 11.4% gain over the following 15 days. Historical data suggests this specific "holiday-run" behavior for LRCX has an 86% accuracy rate.
Live Beta Testing and Recent Performance Metrics
Following an extensive period of backtesting, TradeSmith conducted a live beta test of the BPA system during January and February of the current year. The results of this internal testing phase mirrored the historical data, providing the firm with the confidence to move toward a public launch.
One notable trade during the beta phase involved Equifax Inc. (EFX), a leader in consumer credit reporting. The BPA system flagged a "mean reversion" pattern unique to EFX: the signal triggered when the stock closed lower for four consecutive days while market volatility (measured by the VIX or similar internal metrics) rose above its 10-day average. This specific "fear-based" entry point for EFX resulted in a 15.2% gain in just seven trading days.
The system’s application has also extended into the derivatives market. According to TradeSmith’s internal reports, the BPA signals have been applied to options trading with significant results. Documented gains from these signals included:
- A 147% return on Advanced Micro Devices (AMD)
- A 115% return on the SPDR S&P 500 ETF Trust (SPY)
- An 84% return on Abercrombie & Fitch (ANF)
- A 101% return on the Technology Select Sector SPDR Fund (XLK)
Institutional Context and Technical Infrastructure
TradeSmith’s expansion into AI-driven behavioral profiling is backed by significant institutional resources. Based in Baltimore, the company employs a team of 65 professionals, including data scientists, software engineers, and financial analysts. With an annual research and development budget of approximately $8 million, the firm manages analytical systems used by over 134,000 investors across 86 countries. These users collectively oversee more than $29 billion in assets using TradeSmith’s suite of tools.
The BPA system is the latest addition to a portfolio that includes TradeStops, a risk-management tool designed to automate sell signals and minimize emotional bias in trading. The firm’s "Research Lab" functions as a quantitative incubator, testing algorithmic strategies and market health indicators. This infrastructure allows TradeSmith to compete with institutional hedge funds, providing retail and self-directed investors with access to sophisticated data processing that was previously the exclusive domain of Wall Street firms.
Strategic Chronology and Upcoming Launch Event
The development of the Behavioral Profile Analysis system has followed a rigorous timeline:
- Phase I (Research & Development): A 12-month period dedicated to data mining and the identification of behavioral "thumbprints" across the S&P 500 and Russell 2000 indices.
- Phase II (Historical Backtesting): Exhaustive testing of signals against 20 years of market data to establish accuracy benchmarks.
- Phase III (Internal Beta Testing): A two-month live test in early 2024 to validate the software’s performance in current market conditions.
- Phase IV (Public Beta Access): Currently, TradeSmith is offering early access to a final beta version of the software for registered participants.
- Phase V (Official Launch): CEO Keith Kaplan will host the "AI Signals Trading Event" on Wednesday, April 22, at 10 a.m. Eastern Time, where the full capabilities of the system will be demonstrated to the public.
Broader Impact and Market Implications
The introduction of BPA technology comes at a time when "signal decay" is a growing concern for quantitative traders. As popularized by Renaissance Technologies—the hedge fund founded by Jim Simons that achieved legendary status through mathematical modeling—financial signals often have a limited shelf life. Once a market anomaly is discovered and exploited by a large number of participants, the edge typically disappears.
TradeSmith has addressed this phenomenon by incorporating a "decay monitoring" feature within the BPA system. The software continuously evaluates the performance of its identified patterns; if a specific behavioral profile stops delivering results, the system is designed to "kill" the signal and search for new emerging patterns. This dynamic approach is essential in a market environment where high-frequency trading (HFT) and AI-driven bots can neutralize traditional technical indicators within weeks or even days.
Industry analysts suggest that the democratization of these high-level analytical tools could level the playing field for self-directed investors. By focusing on individual stock behavior rather than broad market trends, investors may be able to find pockets of opportunity that are overlooked by larger institutional funds that require massive liquidity to enter and exit positions.
As the financial world moves closer to the April 22 launch, the focus remains on whether AI-driven behavioral profiling can maintain its high accuracy rates amidst global economic uncertainty and shifting interest rate environments. For TradeSmith, the launch represents more than just a new product; it is a bid to redefine how the average investor perceives and interacts with the complexities of the modern stock market. By treating stocks as individual entities with unique psychological profiles, the firm aims to transform market data from a chaotic stream of numbers into a readable map of predictable human and algorithmic behavior.