


Geopolitical Turbulence and the Energy Market Spike
The primary driver of market anxiety remains the escalating conflict in the Middle East, which reached a fever pitch over the weekend. Both the U.S. benchmark, West Texas Intermediate (WTI), and the European benchmark, Brent crude, saw prices spike to roughly $115 per barrel during Sunday evening trading. The catalyst for this movement was a series of reports indicating direct strikes on energy infrastructure and leadership targets.
According to regional reports and intelligence sources, Israeli airstrikes reportedly targeted oil storage facilities in Tehran. Further compounding the supply-side fear were unconfirmed reports regarding injuries sustained by high-ranking Iranian officials during these sorties. The immediate market reaction reflected a "war premium," as traders priced in the possibility of a total disruption of maritime traffic through the Strait of Hormuz. The Strait is widely considered the world’s most important oil transit chokepoint, with approximately 20% of the world’s liquid petroleum consumption passing through the narrow waterway daily.
As of Monday morning, prices have moderated significantly. WTI was trading near $96 per barrel, while Brent hovered around $99. This pullback was triggered by two factors: a meeting of G7 finance ministers to discuss a coordinated release from Strategic Petroleum Reserves (SPR) and a statement from the White House. President Donald Trump indicated in a recent interview that military initiatives in the region were "ahead of schedule" and that the conflict could be nearing a conclusion. While no official coordinated SPR release has been finalized, the mere prospect of increased supply helped cap the immediate price rally.
Technical Analysis: The 200-Day Moving Average Test
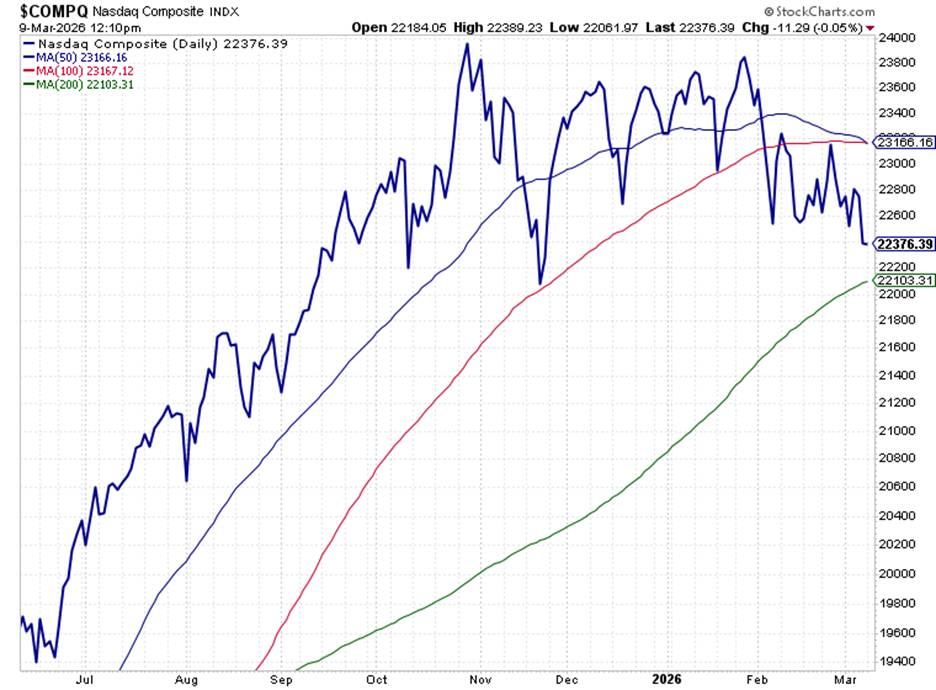
While energy markets fluctuated, the broader U.S. equity market faced its own set of challenges. The S&P 500, the Dow Jones Industrial Average, and the Nasdaq Composite have all retreated into what technical analysts describe as "no-man’s land." This zone is defined as the area between the 100-day moving average (a medium-term trend indicator) and the 200-day moving average (a long-term trend indicator).
Market experts, including hypergrowth specialist Luke Lango, have noted that markets rarely find a "durable bottom" while suspended between these two levels. Historically, when an index loses the support of its 100-day moving average, it tends to "flush" down to test the 200-day average. On Monday morning, the Nasdaq Composite briefly touched its 200-day moving average before staging a tentative intraday recovery.
For institutional investors, the 200-day moving average is a psychological and mathematical floor. A decisive break below this level on heavy volume often triggers automated sell programs, leading to accelerated downward pressure. Conversely, a "bounce" off this level, accompanied by a reversal candle, is often viewed as a high-probability entry point for long positions. Analysts are currently watching for a "reclamation" of the 100-day average as a sign that the current volatility is merely a healthy correction within a larger uptrend.
The Labor Market and the Federal Reserve’s Dilemma
Compounding the uncertainty of the geopolitical landscape is the latest data from the U.S. Department of Labor. On Friday, the Bureau of Labor Statistics reported a loss of 92,000 jobs for the month of February. This figure was significantly lower than consensus estimates and marked a stark departure from the robust hiring trends seen throughout the previous year.
However, economists have urged caution in interpreting this headline figure. The February data was heavily influenced by two non-economic factors:
- Labor Unrest: A large-scale strike within the healthcare sector removed tens of thousands of workers from active payrolls during the survey period.
- Meteorological Disruptions: Severe winter weather across the Northeast and Midwest led to temporary business closures and reduced hours, further depressing the payroll numbers.
Despite these distortions, the underlying trend suggests a labor market that is no longer "red hot" but is instead "cooling." For the Federal Reserve, this presents a significant policy challenge. Typically, the Fed maintains a dual mandate: maximum employment and price stability. Rising oil prices act as a regressive tax on consumers and drive headline inflation higher, which would normally encourage the Fed to keep interest rates elevated. However, a contracting labor market suggests that the economy may need lower rates to prevent a recession. This "stagflationary" setup—rising costs coupled with slowing growth—is the most difficult environment for central bankers to navigate.
Stage Analysis: A Framework for Market Cycles
To navigate this volatility, many professional traders employ a framework known as "Stage Analysis." This methodology, popularized by Stan Weinstein, posits that every stock or index moves through four distinct phases:
- Stage 1 (Accumulation): Following a decline, the asset moves sideways as "strong hands" begin buying from "weak hands."
- Stage 2 (Markup): The asset breaks out of its sideways range on high volume. This is the phase where the most significant capital gains are realized.
- Stage 3 (Distribution): The uptrend stalls, and the asset moves sideways again as institutional investors begin to offload positions to retail buyers.
- Stage 4 (Decline): The asset breaks below support levels and enters a sustained downtrend.
Currently, many sectors—particularly AI infrastructure and technology—appear to be testing the limits of Stage 2. The recent pullbacks are being analyzed to determine if they are "buyable dips" within a Stage 2 markup or the beginning of a Stage 3 distribution. By letting "price lead the way," investors can avoid the trap of "frontrunning" a bottom and instead wait for the market to confirm its next direction.
Mean Reversion and the Oil Trade
While the United States Oil Fund (USO) has provided significant returns for those who entered the trade early—gains of approximately 23% in a single week—analysts are now warning against "chasing" the rally. This caution is based on the principle of mean reversion. In financial markets, mean reversion is the theory that prices eventually return to their long-term average after an extreme deviation.
Energy analysts, including Brian Hunt, suggest that the oil sector is currently "overextended." After a month of near-vertical price action, the sector is due for a "breather." Furthermore, there are political incentives to stabilize prices. High gasoline prices are historically unpopular during election cycles, and the current administration has a vested interest in curbing energy inflation before it impacts the broader economy. Consequently, the odds favor a correction in oil prices in the near term, particularly if diplomatic efforts in the Middle East prove successful.
Broader Impact and Economic Outlook
The confluence of these events suggests a transitional period for the global economy. The "Operation Epic Fury" military initiative, as it has been dubbed in some circles, has the potential to reshape Middle Eastern geopolitics, but its immediate impact is felt at the gas pump and in the manufacturing sector.
If the 200-day moving average support holds for the major indexes, the market may see a rotation back into "risk-on" assets, particularly those tied to artificial intelligence and domestic infrastructure. However, if the support fails, the S&P 500 could see a further decline toward the 6,520–6,550 zone, which represents the lows established in late 2025.
In the coming weeks, the focus will remain on three key pillars: the frequency and intensity of geopolitical headlines, the Federal Reserve’s interpretation of the "noisy" February jobs data, and the ability of the market to maintain its long-term technical support levels. For the disciplined investor, the current environment demands a "wait and see" approach, prioritizing capital preservation until the market provides a clear signal that the current period of volatility has concluded. Professional consensus remains that while the long-term outlook for innovation-driven sectors remains positive, the short-term path is likely to remain fraught with "choppy" price action and headline-driven swings.


