






Market Seasonality and the Presidential Cycle Signal Imminent Shift in S&P 500 Performance Trends

The Standard & Poor’s 500 Index is approaching a critical seasonal inflection point on July 23, marking the conclusion of a historically reliable bullish window. Financial analysts and quantitative researchers have noted that while market fundamentals currently appear robust, historical performance patterns suggest a transition toward increased volatility and potential downward pressure in the second half of the year. This shift is being driven by a convergence of short-term seasonal exhaustion and the broader influence of the four-year presidential election cycle, according to recent findings released by TradeSmith, a financial technology and research firm.
The current market environment has been characterized by significant fluctuations, particularly within the technology sector, even as broader economic indicators remain positive and the quarterly earnings season begins with strong preliminary results. However, the conclusion of the "bullish window" on July 23 suggests that the momentum which has propelled the S&P 500 in recent weeks may be reaching a point of saturation. Quantitative analysis of the past 15 years indicates that the weeks leading up to late July have consistently served as a period of growth for the index, but the expiration of this window often precedes a "grind" where buy-and-hold strategies face diminished returns.
Historical Foundations of Pattern Recognition in Finance
The methodology behind predicting market cycles relies on the premise that historical data can illuminate future trends, a concept famously mirrored in the field of astronomy. In the late 17th century, Edmund Halley utilized historical sighting records to determine that the comet now bearing his name followed a regular 76-year schedule. By identifying this pattern, Halley transformed what was once viewed as a chaotic omen of war and plague into a predictable celestial event.
Modern financial researchers, including TradeSmith CEO Keith Kaplan, apply a similar logic to the equities market. By processing decades of market data through advanced algorithms, researchers have identified "seasonality" windows—specific calendar periods when stocks have historically demonstrated a high probability of rising or falling. These periods, often referred to as "green days," represent stretches of time where market participants have historically seen the most consistent gains.
The "Breakthrough 2026" research initiative led by Kaplan suggests that these patterns are often invisible to the average investor but become apparent when analyzed through the lens of long-term quantitative backtesting. An 18-year backtest of these seasonal trades reportedly delivered a total growth of 857%, a figure that more than doubles the performance of the S&P 500 over the same duration. Even during the financial crisis of 2007—the worst year in the test period—the strategy maintained an average gain of 2.5% and an annualized return of 37.9%, significantly outperforming the broader market’s average annual gains.
The Convergence of July Earnings and Seasonal Shifts
The impending close of the bullish window on July 23 is particularly significant due to its synchronization with the second-quarter earnings reports of several "Magnificent Seven" technology companies. Heavyweights such as Tesla, Amazon, Apple, and Microsoft are scheduled to release their financial results around this timeframe.

Market analysts observe that expectations for these high-growth firms are currently elevated to a degree that makes them vulnerable to "perfection pricing." In such a scenario, a company may report earnings that exceed analyst estimates yet still experience a share price decline because the results did not meet the market’s more aggressive internal projections. A historical precedent for this occurred in late 2023 when Palantir, a leader in artificial intelligence software, exceeded earnings expectations but saw its stock price drop by nearly 8% in a single trading session, creating a drag on the wider index.
The expiration of a favorable seasonal window during a period of sensitive earnings reports creates a high-risk environment. If the largest contributors to the S&P 500’s market capitalization fail to catalyze further growth, the index may be forced into a period of consolidation or correction as the "green days" calendar expires.
The Presidential Election Cycle and the 2026 Outlook
Beyond short-term seasonal patterns, a much larger four-year cycle is currently influencing market projections. Known as the Presidential Election Cycle, this theory was first popularized in the 1960s by market historian Yale Hirsch. Hirsch’s research, which spans back to 1933, posits that the stock market moves in a rhythmic fashion dictated by the four-year political calendar of the United States.
Historically, the first and second years of a presidential term are the most volatile and often the weakest for equities. Data indicates that approximately 70% of U.S. bear markets have commenced during these first two years. As the market looks toward 2026, it enters the second year of the next presidential term—a period traditionally associated with midterm election turbulence and policy uncertainty.
Recent history supports this cyclical theory. During the second year of President Joe Biden’s term in 2022, the S&P 500 experienced a significant decline of 18%. Similarly, the second year of President Donald Trump’s first term saw a 4% market drop. These "sophomore slumps" in the market are often attributed to the administration’s push for more difficult or controversial legislative agendas early in the term, coupled with the market’s unease regarding the potential for shifts in congressional power during midterm elections.
Quantitative Analysis of the "Green Days" Phenomenon
The TradeSmith research team utilizes a system that tracks over 5,000 individual stocks to identify these seasonal windows. By isolating periods where a stock has historically climbed with high reliability, the system attempts to bypass the noise of daily market fluctuations.
The data supporting this approach is substantial. In the model portfolio developed through this seasonality research, an initial investment of $10,000 was shown to grow to $85,700 over the 18-year test period. This performance outperformed the S&P 500 by an average of 99% across various market cycles, including the prolonged bull market of the 2010s and the sharp selloffs associated with the COVID-19 pandemic and the 2008 financial crisis.
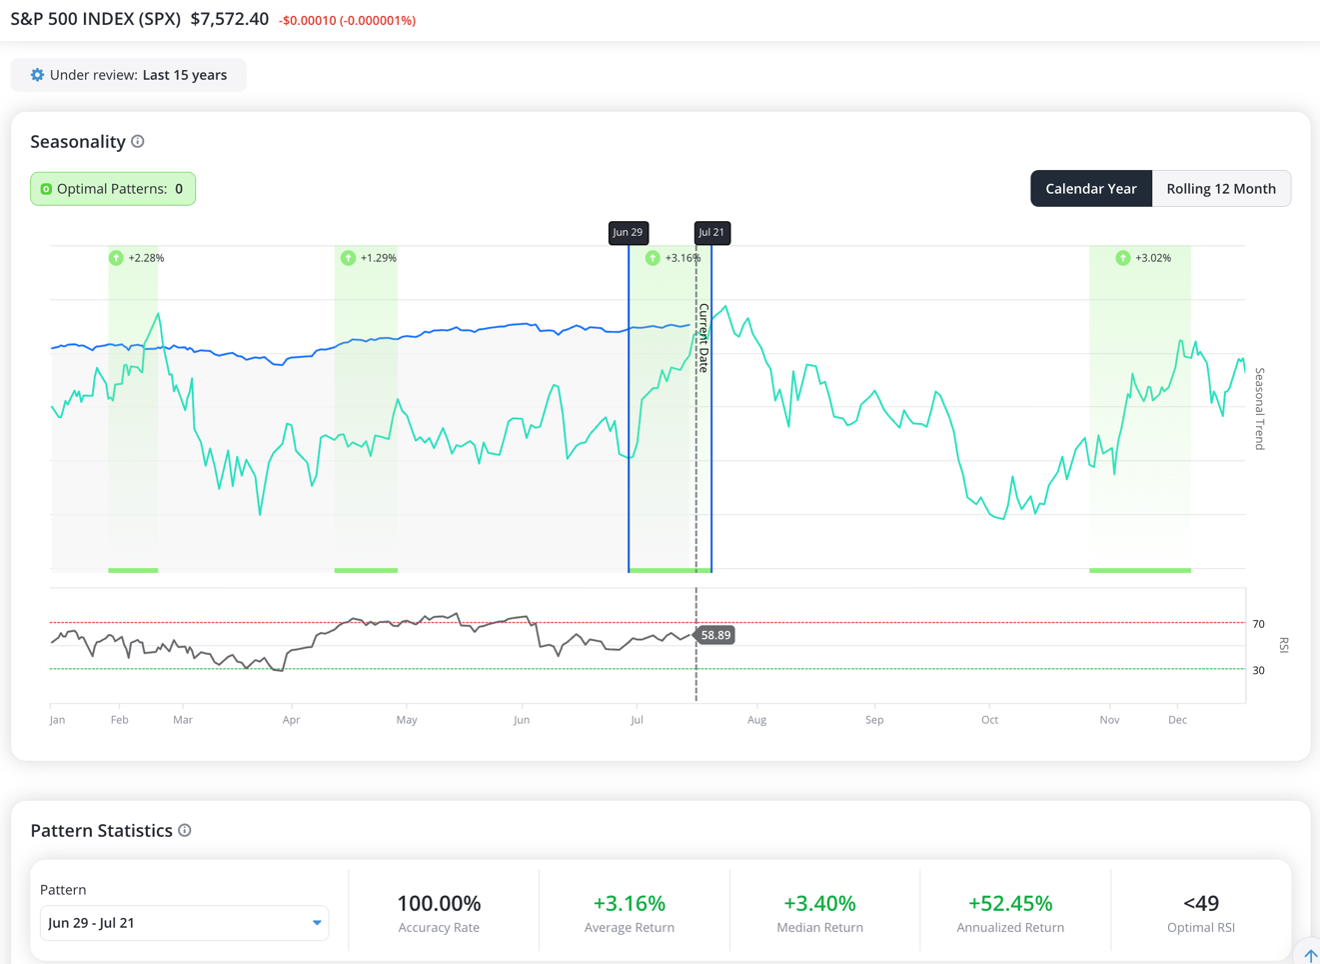
The current "green day" window for the S&P 500 has been active for several weeks. During this time, the index has largely adhered to its 15-year historical average of gains for this specific calendar stretch. However, the reliability of these windows is predicated on knowing when to exit as much as when to enter. The data indicates that the favorable conditions of early summer historically dissipate by the final week of July, giving way to a more challenging environment for the remainder of the third quarter.
Broader Implications for Active and Passive Investors
The conclusion of the current bullish window and the looming influence of the Presidential Election Cycle present different challenges for various types of investors. For "buy-and-hold" or passive investors, these findings suggest a period of stagnation or "slow grind" where the index may move sideways for several months. In a market where volatility is already elevated, the lack of a clear upward seasonal catalyst can lead to frustration for those expecting the momentum of the first half of the year to continue unabated.
Conversely, for active traders and institutional investors, the end of the seasonal window is viewed as an opportunity to adjust portfolio allocations. The transition from a "green" seasonal period to a neutral or "red" one often involves rotating out of overextended sectors—such as high-beta technology—and into more defensive positions or utilizing hedging strategies to mitigate downside risk.
Financial experts suggest that the following steps are critical for investors navigating this transition:
- Portfolio Rebalancing: Assessing gains made during the first half of the year and locking in profits before the July 23 inflection point.
- Earnings Scrutiny: Monitoring the guidance provided by mega-cap tech firms, as their outlooks for the second half of the year will either validate or challenge current seasonal theories.
- Political Awareness: Beginning to factor in the 2026 midterm cycle, which historically introduces policy volatility that can impact sector-specific performance (e.g., healthcare, energy, and defense).
While historical patterns like seasonality and the Presidential Cycle do not guarantee future results, they provide a statistical framework for risk management. In a market often driven by emotion and short-term headlines, these multi-decade patterns offer a data-driven perspective on where the S&P 500 may be headed as the summer bullishness begins to fade. The upcoming week will serve as a litmus test for the predictive power of these cycles, as the market balances the weight of corporate earnings against the historical gravity of the July seasonal shift.