


The Bureau of Labor Statistics released the latest Consumer Price Index (CPI) report on Wednesday morning, providing a snapshot of inflationary trends that, under normal market conditions, would be greeted with cautious optimism by Wall Street. The headline inflation figure rose 0.3% for the month, bringing the annual rate to 2.4%. Both figures aligned perfectly with consensus forecasts from economists. Core CPI, which excludes the volatile categories of food and energy to provide a clearer view of underlying price stability, increased 0.2% on a monthly basis and 2.5% over the last twelve months.
A significant highlight of the report was the cooling of shelter costs, which represent the largest weighting in the CPI basket and have been a primary driver of "sticky" inflation over the past two years. The shelter component rose only 0.2% month-over-month, while rent costs specifically increased by just 0.1%. This represents the smallest monthly rise in rent since January 2021, suggesting that the long-awaited disinflation in the housing sector is finally manifesting in official government data. However, despite these favorable numbers, market analysts are increasingly dismissing the report as an "archival document" rather than a predictive tool for future monetary policy.
The Lagging Indicator Problem and the Energy Shock
The primary reason for the market’s muted reaction to the CPI data is its retrospective nature. The figures released today reflect the economic environment of the previous month, effectively capturing the state of the U.S. economy before the recent geopolitical escalation in the Middle East. The onset of conflict involving Iran has introduced a massive variable into the inflation outlook that is not yet reflected in the 2.4% headline figure.
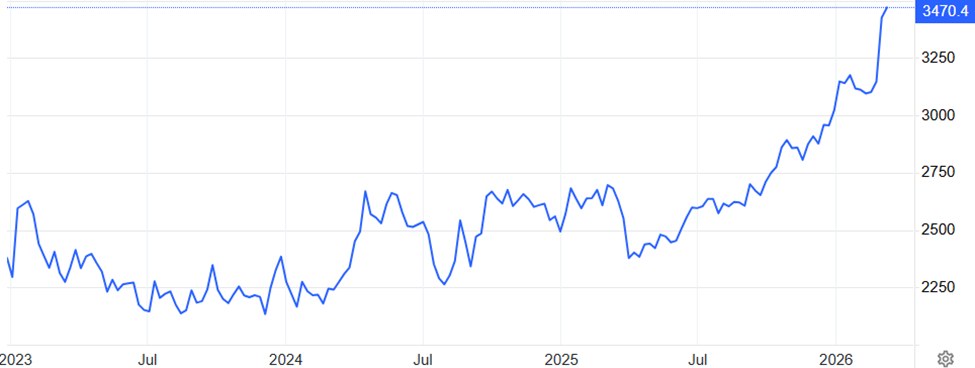
The timeline of the recent energy shock illustrates the speed at which the economic landscape has shifted. During the week of February 21–27, 2026, West Texas Intermediate Crude (WTIC) was trading at a stable average of approximately $65 per barrel. Following the outbreak of hostilities and subsequent U.S. strikes, oil prices experienced a violent spike, briefly touching $115 per barrel during Sunday evening trading sessions as panic gripped global energy markets.
While prices have since retreated to the upper-$80 range as of mid-week, the current price remains approximately 34% higher than the levels seen just two weeks ago. This "new normal" for energy costs threatens to reverse the progress made in the shelter and services sectors. Because energy is a primary input for transportation, manufacturing, and agriculture, a sustained period of oil in the $80–$90 range will likely lead to a resurgence in "headline" inflation in the coming months, potentially forcing the Federal Reserve to maintain higher interest rates for longer than investors had previously anticipated.
Global Response and IEA Emergency Intervention
The severity of the disruption prompted an unprecedented response from the International Energy Agency (IEA). On Wednesday, the agency announced the release of 400 million barrels of oil from emergency reserves. This move represents the largest collective release in the organization’s history, aimed at stabilizing a market rattled by the threat of supply chain closures in the Persian Gulf.
Fatih Birol, the Executive Director of the IEA, emphasized the gravity of the situation, stating that the challenges facing the oil market are "unprecedented in scale." The agency’s intervention is designed to bridge the gap in supply caused by the conflict, but its long-term efficacy remains a point of contention among energy analysts. If geopolitical tensions do not subside, the emergency release may only provide a temporary ceiling for prices rather than a return to the $60 range. For investors, the trajectory of oil prices is now a more critical inflation metric than the lagging CPI data.
Aluminum Surges Amid Supply Chain Fragility
Oil is not the only commodity responding to the regional instability. Aluminum prices have quietly surged nearly 10% over the last week, reaching a three-year high. This movement is driven by the fact that the Middle East accounts for approximately 9% of the world’s total aluminum production. Any perceived threat to the shipping lanes or the energy-intensive smelting facilities in the region immediately translates into a risk premium for the metal.
Beyond the immediate geopolitical catalysts, aluminum is benefiting from a massive structural shift in global demand related to the expansion of Artificial Intelligence (AI) infrastructure. While much of the investment focus regarding AI has centered on software and high-end semiconductors, the "physical backbone" of the technology requires vast amounts of industrial metals.
High-voltage transmission lines, which are essential for feeding power to massive AI data centers, consume between one and two tons of aluminum for every megawatt of power delivered. As the global energy grid is overhauled to accommodate the soaring electricity demands of generative AI hubs, the appetite for aluminum is projected to grow from 104 million tons in 2024 to an estimated 120 million tons by 2030. This combination of short-term supply shocks and long-term structural demand has created a potent environment for mining and production companies.
Corporate Spotlight: Alcoa’s Technical and Fundamental Position
Alcoa (AA), the largest producer of aluminum in the United States, has emerged as a focal point for investors looking to capitalize on these trends. The company’s stock has shown significant resilience, trending higher after recovering from a selloff earlier in the year triggered by tariff concerns.
From a fundamental perspective, Alcoa stands to benefit from higher realized prices for aluminum and its upstream products, alumina and bauxite. However, market technicians are also paying close attention to the stock’s price action through the lens of "Stage Analysis," a framework that categorizes a stock’s lifecycle into four distinct phases:
- Stage 1 (Basing): A period of consolidation after a decline where the stock moves sideways.
- Stage 2 (Advancing): A sustained breakout and uptrend characterized by higher highs and higher lows.
- Stage 3 (Topping): A period where the uptrend loses momentum and the stock churns as buyers and sellers reach equilibrium.
- Stage 4 (Declining): A sustained downtrend following a breakdown from the Stage 3 top.
Alcoa spent much of 2025 in a robust Stage 2 advance, with its gains accelerating in the fourth quarter of the year. In early 2026, the stock entered a Stage 3 consolidation phase, trading in a range between the high $50s and mid-$60s. As of mid-March, Alcoa is testing the upper limits of this range. Technical analysts suggest that a "convincing breakout" above the $66 level, accompanied by trading volume two to three times the daily average, would signal the resumption of a Stage 2 advance.
Broader Market Implications and the "Physical" AI Trade
The shift in focus from CPI data to commodity prices reflects a broader maturation of the current market cycle. While the "AI Revolution" was initially driven by speculation in application software and chip designers, the second phase of the trade is increasingly focused on the companies that provide the "bones" of the new economy. This includes power generation, cooling systems, and the raw materials required for infrastructure.
The current geopolitical climate acts as an accelerant for this transition. As energy and metal prices rise, the cost of building out the virtual world increases. This creates a divergence in the market: software platforms with high price-to-earnings multiples may face headwinds from rising discount rates and input costs, while the "miners and builders" who own the physical assets may see their margins expand.
For the Federal Reserve, this environment presents a significant challenge. The cooling of shelter inflation—a key goal for the central bank—is being offset by a "cost-push" inflation narrative driven by energy and industrial commodities. If the IEA’s release of 400 million barrels fails to bring WTIC prices back toward the $70 mark, the "expected" CPI numbers seen this morning may represent the floor for inflation in 2026, rather than the ceiling.
Investors are encouraged to look past the headline numbers and monitor the price action in the commodities complex. The technical setup in stocks like Alcoa provides a real-time gauge of market sentiment regarding these inflationary pressures. If the breakout above $66 occurs, it will serve as a signal that the market is pricing in a prolonged period of high commodity demand and persistent price levels, regardless of what the backward-looking CPI reports suggest.


