






Bitcoin Reclaims Critical 200-Day Moving Average Amid White House Crypto Summit and Strategic Treasury Bond Buybacks

Bitcoin (BTC) surged past the $75,000 threshold this week, marking a potential end to the prolonged "dead zone" that has characterized the digital asset market since the April 2024 halving. This price action was precipitated by a confluence of high-level political engagement at the White House, a significant shift in Treasury Department liquidity operations, and the reclamation of a vital long-term technical indicator. On Wednesday, Bitcoin closed above its 200-day moving average for the first time since a "death cross" formed on November 16, 2025, signaling what many analysts believe to be a structural trend reversal rather than a transient rally.
The market’s momentum was initially ignited by a summit hosted by President Trump, where the administration signaled its intent to integrate digital assets into the national balance sheet. However, market data suggests that the rally’s magnitude was equally driven by a strategic expansion of bond buybacks by Treasury Secretary Bessent. These macroeconomic and political developments have collectively pushed Bitcoin through a series of resistance levels, forcing the liquidation of approximately $3 billion in short positions and providing the necessary "fuel" to breach the $69,000 and $74,000 marks.
The White House Summit and the Strategic Reserve Proposal
On Wednesday, the Trump administration convened a high-profile meeting with leading cryptocurrency executives to discuss the future of digital asset regulation and the possibility of a national strategic reserve. During the event, President Trump stated that his administration is "considering" sizable purchases of Bitcoin and other digital assets. This rhetoric aligns with the Strategic Bitcoin Reserve executive order issued in March 2025, though concrete details regarding budget authorization and a specific acquisition timeline remain undisclosed.
The summit also served as a platform for the President to reiterate his support for the CLARITY Act. He called on Congress to finalize a "fair version" of the legislation, which aims to provide a comprehensive regulatory framework for stablecoins and digital asset service providers. While the administration’s language has remained consistent for several months, the timing of the summit acted as a psychological catalyst for the market, coinciding with a broader shift in institutional sentiment.
Furthering the administrative push, the Commodity Futures Trading Commission (CFTC) launched its newly formed Innovation Advisory Committee on Thursday. The 35-member committee is heavily weighted toward industry practitioners, featuring CEOs from prominent firms including Coinbase, Robinhood, Polymarket, and Kalshi. During the proceedings, it was noted that CFTC Chair Selig is actively working to bring offshore derivatives platforms, such as Hyperliquid, under a compliant onshore framework. This regulatory outreach contributed to double-digit gains in specific ecosystem tokens, reinforcing the narrative of a maturing domestic crypto industry.
Treasury Liquidity Operations and the $3 Billion Short Squeeze
While political headlines dominated the news cycle, institutional analysts pointed to Treasury Secretary Bessent’s actions as the more precise driver of the week’s volatility. The Treasury Department announced a doubling of its long-term bond buyback operations, increasing the scale from $2 billion to at least $4 billion per operation. This move effectively injects liquidity into the financial system, lowering the "term premium" on long-term yields and creating a favorable environment for risk-on assets.
The sudden influx of liquidity caught many market participants off guard. Bitcoin’s rapid ascent through the $69,000 resistance level triggered a massive short squeeze. According to exchange liquidation data, roughly $3 billion in bearish bets were wiped out in a 24-hour window. This mechanical buying pressure provided the velocity needed for Bitcoin to push toward the $75,000 level on Thursday. Analysts suggest that while the White House summit provided the "story" for the rally, the Treasury-induced short squeeze provided the "size."

Technical Analysis: The 200-Day Moving Average Reclaim
From a technical perspective, the most significant development of the week was Bitcoin’s daily close above its 200-day moving average (MA). This indicator is widely regarded by institutional traders as the dividing line between a bull and bear market. Bitcoin had been trading below a declining 200-day MA since the death cross occurred in late 2025, a period often referred to as the "interhalving dead zone."
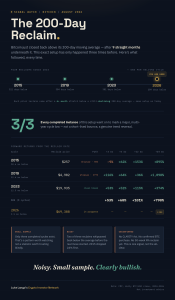
Historical analysis of Bitcoin’s trading history reveals that this specific setup—spending more than six months below a declining 200-day MA followed by a reclaim—has occurred only three times previously: in 2015, 2019, and 2023. In all three instances, the reclaim marked a major, multi-year cycle low rather than a temporary bounce.
- 2015: Following a prolonged bear market, the reclaim of the 200-day MA preceded the historic 2017 bull run.
- 2019: The reclaim marked the end of the "crypto winter" and the beginning of the recovery that led to the 2021 highs.
- 2023: The reclaim signaled the start of the current cycle’s institutional adoption phase.
However, market historians also urge caution. In two of the three previous cases, the price "whipsawed" back below the average before the sustained upward trend began. In 2015, for example, Bitcoin retraced 24% after the initial reclaim before finding a permanent floor. Given that the current breakout was partially fueled by a short squeeze, a retest of the $69,000 level is expected.
The Halving Cycle Chronology and the "Dead Zone"
The current market behavior remains consistent with the historical "halving cycle" pattern. Bitcoin halvings, which occur roughly every four years, reduce the rate of new supply and have traditionally been followed by periods of consolidation followed by exponential growth.
The April 19, 2024, halving initiated the current cycle. Historically, Bitcoin tracks a specific trajectory:
- Post-Halving Lull: A period of 12–18 months where price action remains stagnant or trends downward as the market absorbs the supply shock and wait-and-see investors remain sidelined.
- Cycle Top: Usually occurring 17–18 months post-halving. In this cycle, projections pointed to a top around October 6, 2025.
- Cycle Bottom: Typically forming one year after the top. This places the projected bottom window in mid-to-late October 2026.
Current data shows the 2024–2026 cycle tracking below the trajectories of the 2016 and 2020 cycles on a normalized basis. This deceleration is viewed by economists as a sign of asset maturation. As Bitcoin’s market capitalization reaches the multi-trillion-dollar range, it requires significantly more capital to achieve the same percentage gains seen in its earlier years as a small-cap asset. The current reclaim of the 200-day MA suggests that the market may be emerging from the bottoming phase slightly ahead of schedule, or at the very least, establishing a firm floor for a 2027 recovery.
Regulatory Obstacles: The CLARITY Act and Senate Deadlock
Despite the bullish price action, several fundamental hurdles remain. The legislative path for the CLARITY Act is currently stalled in the Senate. A critical cloture vote is scheduled for September 15, and current whip counts suggest the bill is approximately six Democratic votes short of the 60-vote threshold required to overcome a filibuster.
The CLARITY Act is seen as the "gold standard" for regulatory certainty. It would provide:
- A clear definition of which digital assets are securities versus commodities.
- A legal framework for stablecoin issuers to operate within the federal banking system.
- Protections for self-custody and decentralized finance (DeFi) protocols.
Without the passage of this or similar legislation, the "strategic reserve" comments from the executive branch remain largely rhetorical. Under current law, the administration lacks the budget authorization to conduct large-scale, non-budget-neutral purchases of Bitcoin. For a government purchase mechanism to become a confirmed signal, analysts are looking for a specific budget line item or a dollar-denominated acquisition timeline rather than informal remarks at industry summits.
Future Outlook: Key Resistance and Support Levels
As Bitcoin enters this new phase of price discovery, several key levels will determine the sustainability of the rally.
Immediate Support ($69,000): The current 200-day moving average sits near $69,000. A successful retest and hold of this level would confirm that the reclaim is structural and not merely a result of the short squeeze.
Intermediate Resistance ($82,200): This level represents the May 2026 high and aligns almost exactly with the 50-week moving average. Reclaiming the 50-week MA is historically a "cleaner" signal of a long-term bull market than the 200-day daily MA.
Major Resistance ($85,000): This zone served as a support cluster in late 2025 before breaking down in January 2026. Converting this former support back into a floor is considered the "all-clear" signal for institutional capital that has remained on the sidelines.
The convergence of technical reclaims, macroeconomic liquidity injections, and intensifying political interest suggests that the "dead zone" of the 2024 halving cycle is nearing its conclusion. While the road to new all-time highs is likely to involve further "choppy" price action and legislative delays, the evidence of a genuine trend reversal is more robust now than at any point in the last six months. Investors and policy analysts alike are now looking toward the September Senate vote and the Treasury’s fourth-quarter buyback schedule for the next set of definitive market signals.