





The Evolution of Seasonal Trading Strategies and the Role of Historical Data in Modern Financial Markets

The global financial landscape has entered a period of heightened volatility, characterized by escalating geopolitical tensions in the Middle East and domestic uncertainty regarding the future trajectory of U.S. monetary policy. Recent disruptions in the Strait of Hormuz, a critical maritime corridor for global energy supplies, have highlighted the limitations of traditional market forecasting. As the waterway has been subject to multiple closures and reopenings since early 2024, investors are increasingly questioning the efficacy of "gut-feeling" predictions and headline-driven strategies. In response, a growing segment of the quantitative analysis community is pivoting toward historical pattern recognition and seasonal data as a more reliable framework for capital allocation.
The Fallibility of Expert Forecasting and the Shift to Quantitative Analysis
The difficulty of predicting market outcomes based on current events is well-documented in academic literature. One of the most cited works in this field is by Philip Tetlock, a professor at the Wharton School and author of Expert Political Judgment. Tetlock’s multi-decade study tracked thousands of predictions from economic and political experts, ultimately concluding that the average expert’s accuracy was roughly equivalent to random chance. This phenomenon, often colloquially referred to as the "dart-tossing chimp" effect, suggests that the complexity of global variables—ranging from central bank decisions to unforeseen military conflicts—renders traditional forecasting models highly vulnerable to error.
In light of these findings, firms such as TradeSmith have developed sophisticated software systems designed to bypass the noise of the news cycle. Instead of attempting to forecast the impact of a specific interest rate hike or a corporate earnings report, these systems analyze "calendar windows." This methodology rests on the premise that historical price action repeats itself with a degree of regularity that can be exploited for profit. By analyzing quintillions of data points across thousands of equities, researchers have identified specific dates when the odds of a price increase or decrease are statistically skewed in favor of the investor.
A Historical Precedent: The Nilometer and Pattern Recognition
The philosophy of using the past to navigate the future is not a modern invention but a strategy rooted in ancient history. In ancient Egypt, the Nile River served as the civilization’s economic backbone. The annual flooding of the Nile determined the success of the harvest and, by extension, the stability of the kingdom. Rather than attempting to predict rainfall in distant highlands—a task impossible for the era—the Egyptians developed "Nilometers." These were stone columns marked with historical flood levels.
By comparing current water levels against the marks of previous centuries, Egyptian officials could determine whether the year would bring a "good flood" (leading to surplus), a "bad flood" (causing destruction), or a drought (leading to famine). This early form of data tracking allowed for the planning of taxes, grain storage, and labor allocation years in advance. Modern seasonal trading operates on a similar principle: it does not seek to predict the "weather" of the market but rather measures the "river" of historical price action to identify recurring rhythms.
The Chronology of Seasonal Trading Axioms
Seasonal patterns in financial markets have been observed for centuries, though their precision has evolved alongside computing power.
- Agricultural Origins: The earliest forms of seasonality were tied to the planting and harvest cycles of commodities like wheat and corn. Traders recognized that prices typically dipped during harvest due to increased supply and rose during planting seasons.
- The "Sell in May" Custom: This well-known Wall Street adage originated in the United Kingdom as "Sell in May and go away, stay away until St. Leger’s Day." It referred to the practice of aristocrats and bankers leaving the city for the summer, leading to lower liquidity and stagnant returns during the warmer months.
- The January Effect: Identified in the mid-20th century, this phenomenon describes the tendency of small-cap stocks to outperform the broader market in the first month of the year. This is largely attributed to tax-loss harvesting in December followed by reinvestment in January.
- Modern Algorithmic Seasonality: With the advent of high-frequency trading and big data, seasonality is no longer confined to months or quarters. Contemporary software can now identify "green zones" that last as little as two to three weeks, based on decades of daily price movements.
Case Studies in Historical Precision: SAM and NVDA
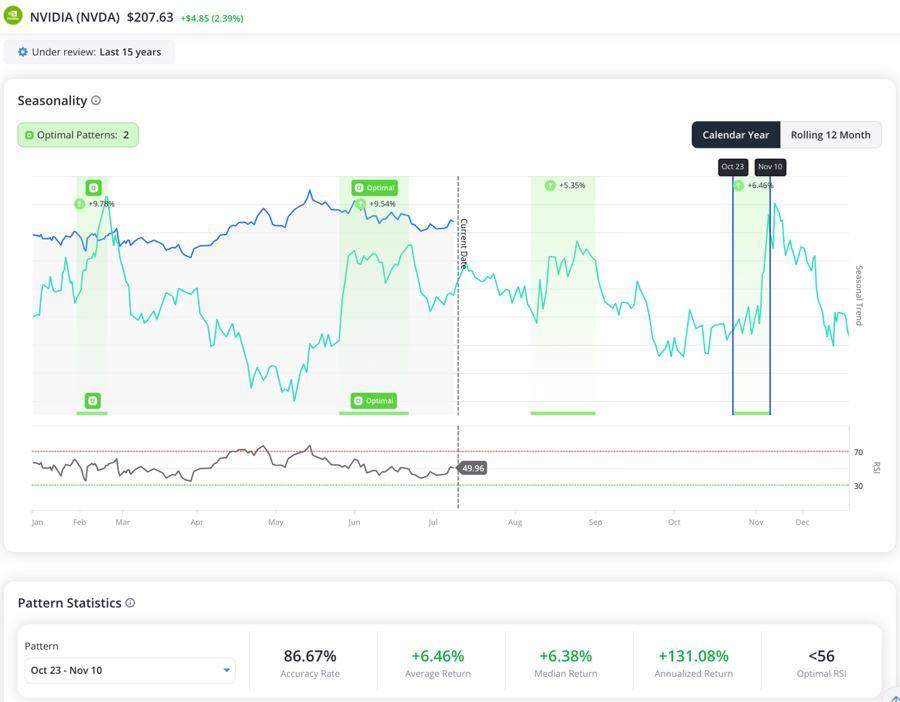
To demonstrate the efficacy of seasonal windows, analysts often point to specific equities that exhibit high-correlation historical patterns. Two notable examples include Boston Beer Company (SAM) and Nvidia Corporation (NVDA).
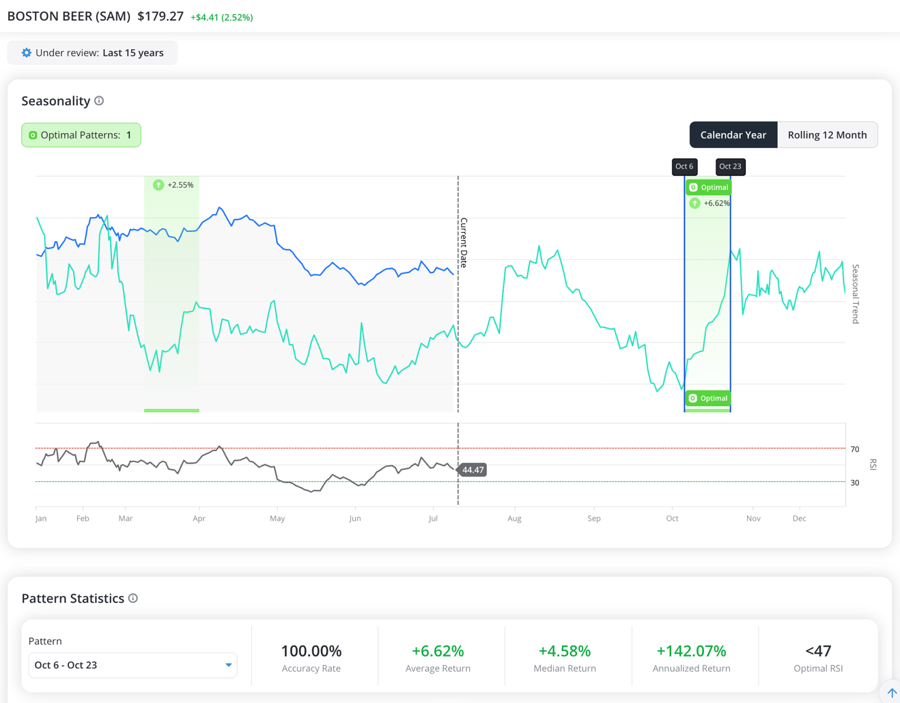
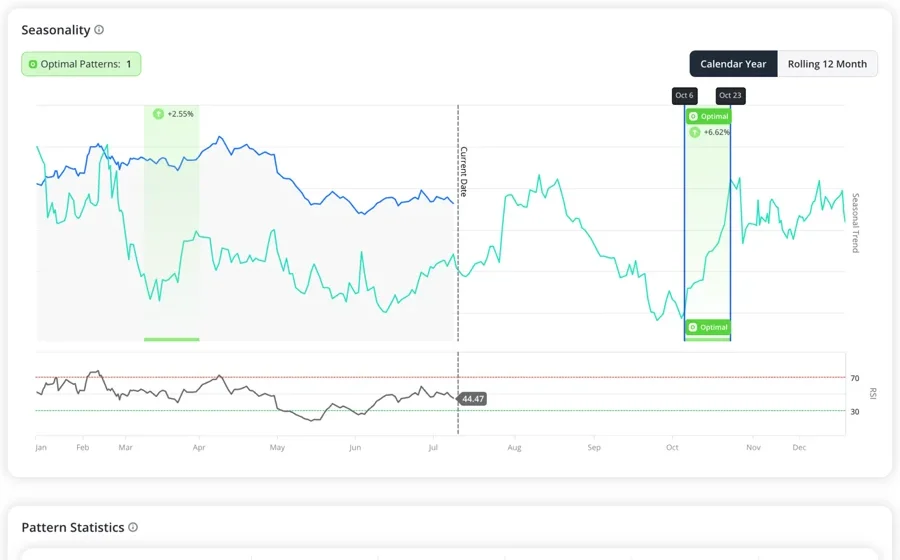
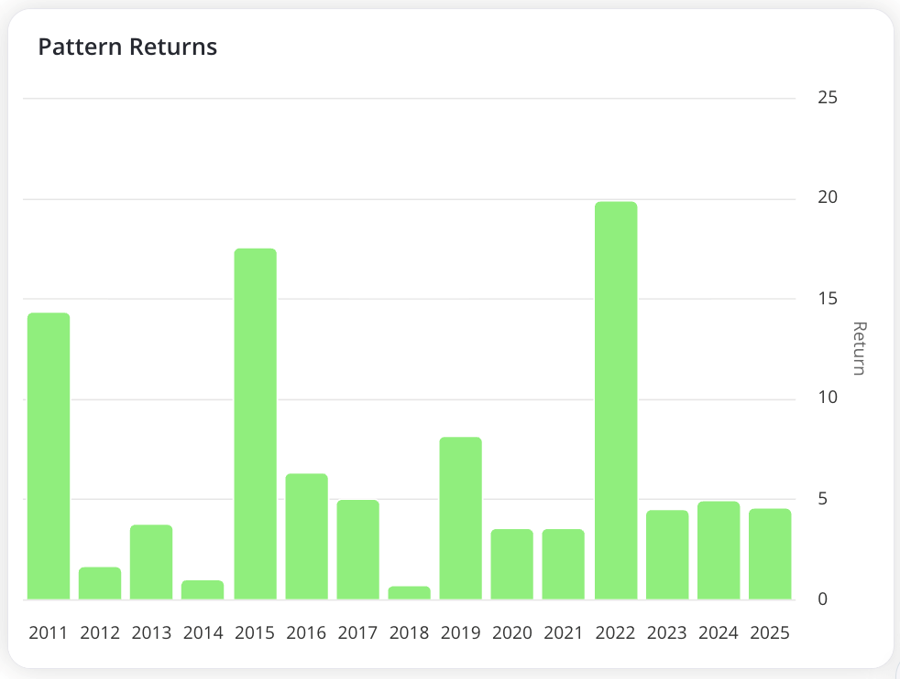
Data analysis reveals that Boston Beer has historically entered a high-probability "green zone" around October 6. Over a 15-year period, the stock has rallied during the subsequent 17-day window 100% of the time. The average gain during this brief period was approximately 6.6%. Crucially, these gains occurred regardless of the broader market’s "bull" or "bear" status, suggesting that internal seasonal drivers—perhaps related to autumn product cycles or institutional rebalancing—outweigh macro narratives.
Similarly, Nvidia, a leader in the artificial intelligence sector, has shown a recurring pattern starting around October 23. Historical data indicates that the stock rose an average of 6.5% over the following 18 days in 13 out of the last 15 years. This pattern was visible as early as 2015, long before Nvidia became a central figure in the AI investment boom. The consistency of these moves suggests that while AI headlines drive long-term sentiment, the stock’s short-term fluctuations are influenced by structural calendar-based factors.
Quantitative Backtesting and Portfolio Performance
The broader application of these seasonal windows has been tested through extensive backtesting. TradeSmith’s research team analyzed more than 2 quintillion historical prices across approximately 5,000 stocks dating back to the 1990s. The goal was to determine if an optimized buying and selling schedule could outperform a traditional "buy and hold" strategy.
The results of an 18-year backtest were significant. A portfolio constructed exclusively around identified seasonal "green zones" turned an initial $10,000 investment into $85,700. This represents a substantial outperformance compared to broader market indices during the same period. The methodology achieved an overall historical accuracy rate of 83%, highlighting the potential for reduced risk and increased consistency when trading is aligned with historical cycles.
Official Responses and Market Implications
While institutional investors have long utilized "quant" strategies that incorporate seasonality, the accessibility of these tools for retail investors is a relatively new development. Market analysts suggest that the democratization of high-level data analysis could lead to a shift in how the average investor approaches volatility.
"The challenge for the modern investor is not a lack of information, but an overabundance of it," noted one quantitative strategist. "By focusing on historical probabilities rather than speculative futures, investors can remove the emotional bias that often leads to poor decision-making during geopolitical crises."
Furthermore, the transition of leadership within the Federal Reserve—with names like Kevin Warsh being discussed for future appointments—introduces a layer of administrative uncertainty. However, proponents of seasonal trading argue that even major policy shifts tend to be absorbed into historical patterns over time. The "presidential election cycle," for instance, is a well-documented seasonal pattern that accounts for shifts in political and economic leadership every four years.
Analysis of Broader Impacts
The reliance on historical data and seasonality has several implications for the future of the financial services industry:
- De-emphasis on Macro-Forecasting: As more data points toward the inaccuracy of expert predictions, there may be a decline in the value placed on traditional economic "punditry."
- Increased Algorithmic Participation: The use of software to identify calendar windows will likely increase, potentially leading to "self-fulfilling prophecies" where seasonal patterns become even more pronounced as more capital flows into them.
- Risk Mitigation: Seasonal strategies offer a form of "temporal diversification." By only being exposed to the market during high-probability windows, investors can theoretically avoid the "droughts" or periods of high volatility that lack historical support for gains.
In conclusion, the current global environment of 2024 and 2025 serves as a reminder of the inherent unpredictability of the future. From the volatile waters of the Strait of Hormuz to the shifting halls of the Federal Reserve, the "noise" of the present can often obscure the path to wealth preservation. By adopting the perspective of the ancient Egyptians and utilizing the modern equivalent of the Nilometer—advanced quantitative software—investors may find that the most reliable guide for tomorrow is not a headline, but the consistent marks left by the past. As the market moves toward 2026, the ability to distinguish between signal and noise will likely remain the primary differentiator between successful and unsuccessful capital management.